
The ECGI blog is kindly supported by
Are firms generating green revenues from the green transition?
Authors


The transition to a low-carbon economy is often discussed in terms of corporate emissions, regulations, or corporate pledges. Less visible but more tangible is the revenue companies generate from selling products and services that contribute directly to environmental solutions. This study employs a measure covering firms worldwide generating such “green revenues” and examines how they have evolved, what drives them, and whether investors reward them.
The measure is based on the FTSE Russell Green Revenues Classification System (GRCS), which quantifies the share of a company’s revenue that comes from products or services with environmental benefits. It covers more than 16,000 listed firms in 48 countries between 2008 and 2023, spanning sectors from renewable energy and electric transport to water infrastructure and sustainable materials. Unlike ESG ratings, which largely assess operational practices, green revenues capture the environmental impact of what companies sell. The study finds only weak correlations between green revenues, ESG scores, and carbon emissions, indicating that this measure offers distinct information about a company’s role in the green transition.
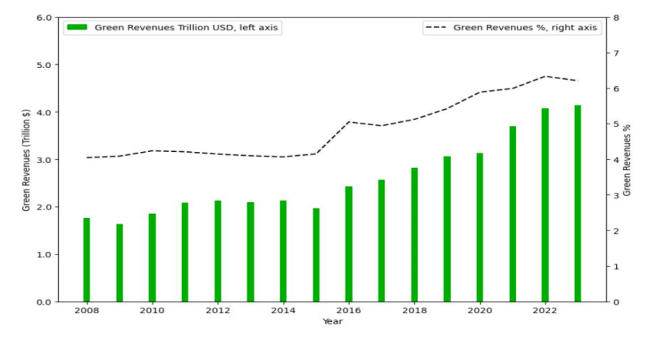
From 2008 to 2015, the global share of green revenues held steady at around 4 percent. Following the 2015 Paris Agreement, an unexpected success in climate diplomacy, that share rose to about 6 percent by 2023, equivalent to USD 4 trillion in annual revenues and therefore comparable to the size of the Oil & Gas sector. The shift is broad-based. Manufacturing, utilities, and technology together account for the largest green revenue shares, while transportion and materials also contribute significantly. Yet traditional energy companies, despite holding green patents, have been slow to convert them into sales, potentially licensing technology to others or using green patents defensively. In absolute terms, the United States, China, and Japan generate the most green revenues. Relative to total revenues, Europe is ahead, with some markets, such as France, above 10 percent. The ramp-up in Europe after 2015 coincided with policy initiatives including the European Green Deal and the rollout of the EU Taxonomy in 2020.
The Growth of Corporate Green Revenues
Two main channels help explain which firms were able to expand their green revenues most strongly after 2015. The first is technological capacity. Firms with at least one green patent before the Paris Agreement increased their green revenue share by an average of 2.3 percentage points more than those without. The effect is specific to green patents and does not appear for patents in general. It is also stronger among US companies, suggesting that innovation was taken to market in response to commercial opportunities rather than solely regulatory pressure. The second factor is investor support. Companies with higher institutional ownership before Paris, particularly by signatories to the PRI or the CDP, saw greater post-Paris growth in green revenues. A one standard deviation higher pre-Paris institutional ownership corresponded to a 0.3 percentage point higher green revenue share after Paris. The support of more patient long-term investors also positively affected the growth in corporate green revenues. Much of the overall increase came from new firms entering the green revenue space rather than only existing green firms expanding their share.
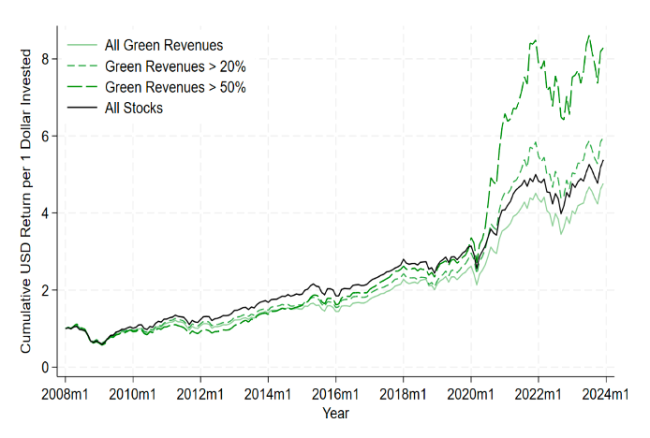
The relationship between green products and shareholder returns is more complex. Across the full 2008 to 2023 period, portfolios of high green revenue firms did not consistently outperform the market once standard risk factors were accounted for. In the post-Paris years, a modest “green alpha” appears, concentrated in US stocks and in firms with very high green revenue shares of over 80 percent. It is strongest among firms that entered the period with green patents or significant institutional backing. Even when excluding Tesla, which makes up a large share of the US green portfolio, the effect persists for the most extreme green portfolios. The evidence points to the outperformance being driven by a lower cost of capital for green firms and investor inflows after unexpected shifts in climate-related concerns, rather than from earnings surprises.
Green Revenues Portfolios Returns
These findings show that green revenues provide a distinct and economically significant view of corporate environmental impact. Their acceleration after 2015 suggests that major global commitments, combined with enabling policy frameworks, can spur measurable change. For investors, green revenues can identify firms positioned to benefit commercially from the green economy in ways not captured by traditional ESG scores. For policymakers, the evidence highlights how regulation, innovation capacity, and investor alignment can work together to accelerate the corporate contribution to environmental goals. Measuring the green economy through revenues reveals not just who is talking about sustainability but who is selling it, and in some cases, who is profiting from it.
_________________
Johannes Klausmann is an Assistant Professor of Finance at the University of Houston – Bauer College of Business.
Philipp Krueger is a Professor of Finance at the University of Geneva and holds a Senior Chair at the Swiss Finance Institute, and an ECGI Research Member.
Pedro Matos is the James A. and Stacy Cooper Bicentennial Professor of Business Administration at the University of Virginia Darden School of Business and an ECGI Research Member.
This blog is based on a paper presented at the 3rd HKU Summer Finance Conference. Visit the event page to explore more conference-related blogs.
The ECGI does not, consistent with its constitutional purpose, have a view or opinion. If you wish to respond to this article, you can submit a blog article or 'letter to the editor' by clicking here.