
The ECGI blog is kindly supported by

Biodiversity Impacts of Renewable Energy
Authors

Our paper studies how the global build out of hydro, solar, and wind power affects biodiversity through land use and habitat destruction.
While renewable energy (RE) is central for climate mitigation, its rapid expansion can fragment ecosystems and encroach on biodiversity sensitive areas, creating a climate–nature trade off. We argue that a lack of standardized, spatially explicit biodiversity metrics has so far prevented a rigorous assessment of these trade-offs at global scale and across ownership and financing structures.
Methodology
We assemble a global asset level dataset of 47,616 utility scale solar, wind, and hydro plants (≥1 MW) commissioned between 2000 and 2025, totaling 1.61 TW of capacity across 190 countries.
They map each plant’s land footprint using Sentinel 2 and Landsat satellite imagery, complemented by machine learning classification for solar, benchmark land use factors for wind, and pre/post dam reservoir inundation for hydro. Plant footprints are overlaid with 5×5 km Threat Abatement STAR (START) scores from the IUCN based STAR metric via IBAT, yielding a plant level index of land use induced biodiversity impact, plus intensity measures per m² and per kW.
We then merge ownership and financing data (S&P Market Intelligence, LSEG Infra 360) to compare impacts by technology, geography, time, listing status, financial vs non financial owners, and project vs corporate finance, using regressions with rich technology–location–year fixed effects.
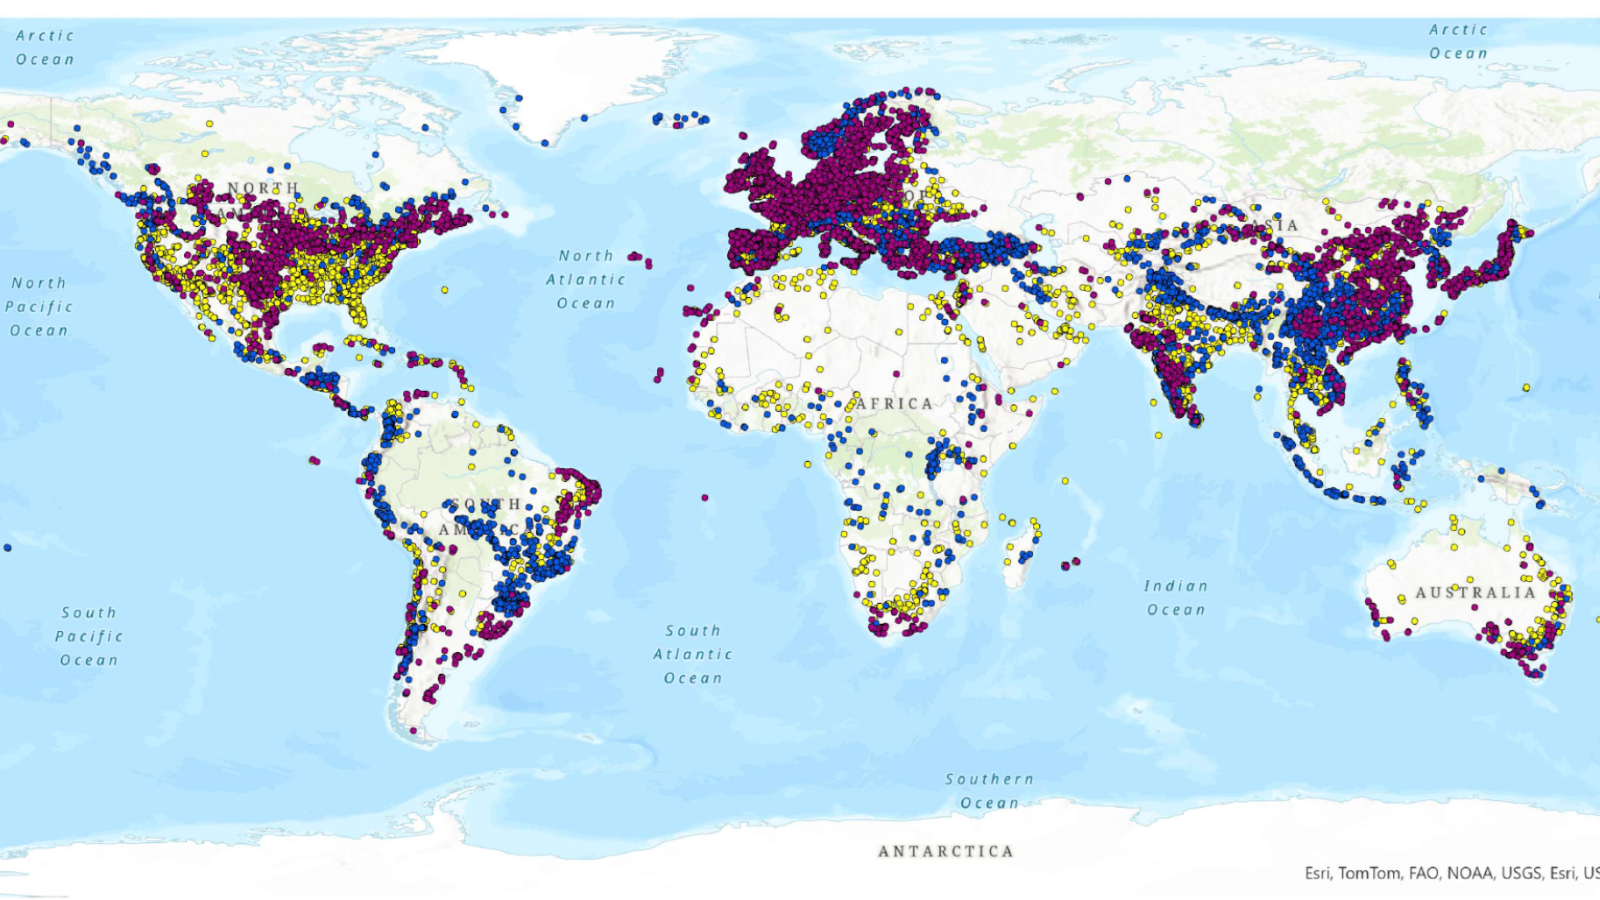
Figure 1: This figure shows the locations of solar plants (yellow), wind plants (purple), and hydro plants (blue) included in the sample. The plants became operational between 2000 and 2025 and meet the minimum capacity threshold of 1 MW.
Key Findings
- Scale and distribution of impacts: The aggregate biodiversity impact of existing RE plants is equivalent to the value of all forest in Austria or all grassland in Thailand and could reach the scale of Canada’s total land biodiversity by 2030 if capacity triples as projected. Impacts are extremely skewed: the median plant has a very low START score, while fewer than 1% of plants account for nearly 70% of total biodiversity impact but only about 2.9% of capacity.
- Technology differences: Solar and hydro together generate almost 90% of RE’s biodiversity impact, with solar highest in total impact due to land intensity and hydro sited in the most biodiversity sensitive locations. Wind contributes relatively little: both total impact and impact per m² are substantially lower than for solar and hydro, though wind still affects sensitive species locally.
- Dynamics over time: Total and median plant level impacts have increased strongly since 2000, driven mainly by growing land use per plant and larger average capacities, with a milder trend toward siting in more sensitive locations. Solar has overtaken hydro as the dominant driver of biodiversity impact in recent years, mirroring the global boom in utility scale photovoltaic plants.
- Alternative siting decisions: The biodiversity impact could be reduced substantially if the worst plants had hypothetically been sited in nearby areas with lower biodiversity values. Focusing on solar and wind, given that hydro projects are tied to specific locations, the authors show that the impact of the worst 1% of plants could be reduced by more than 90% even within a radius of only 10 kilometers. This implies that targeted siting policies, combined with stricter biodiversity safeguards, could have substantially reduced environmental costs without constraining capacity growth.
Table 1: Top 10 RE Power Plants with the Highest Biodiversity Impacts
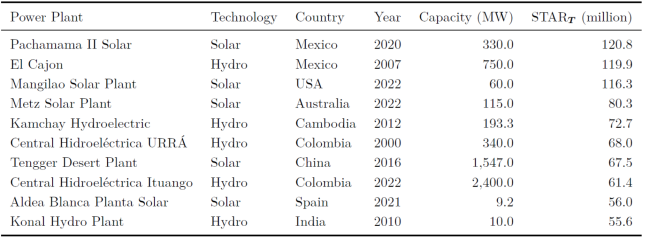
This table shows the ten RE plants in our sample with the highest START score, sorted in descending order. The START score is reported in millions. Year is the year in which commercial operation started and capacity is measured in MW.
Implications and Conclusions
The study shows that climate mitigation via RE expansion and biodiversity conservation are tightly interconnected, and that ignoring siting decisions can lead to substantial unintended nature loss.
Because impacts are highly concentrated in a small number of plants and owners, targeted siting rules, exclusion zones, and restoration policies could dramatically reduce biodiversity costs with limited sacrifice of generation capacity.
Ownership and financing matter: non-listed firms, non-financial owners, and off-balance sheet (SPV) financing are systematically associated with higher impact siting, whereas listed firms, financial owners, balance sheet financing are associated with lower biodiversity impacts.
We conclude that asset level, spatial biodiversity metrics like START can inform investors, regulators, and disclosure frameworks (e.g., TNFD) and should be extended beyond power generation as asset location data become available.
_____________
Haozhou Gong is a Research Postgraduate Student at the University of Hong Kong.
Prof. Chen Lin is Stelux Professor in Finance at the University of Hong Kong.
Zacharias Sautner is Professor of Sustainable Finance at University of Zurich and Senior Chair at the Swiss Finance Institute, and an ECGI Research Member.
Thomas Schmid is an Associate Professor of Finance at the University of Hong Kong.
This blog is based on a paper presented at the Lisbon Sustainability Week 2026, held at Católica-Lisbon School of Business and Economics and organised with Santander Central Services and ECGI. Visit the event page to explore more conference-related blogs.
The ECGI does not, consistent with its constitutional purpose, have a view or opinion. If you wish to respond to this article, you can submit a blog article or 'letter to the editor' by clicking here.